How Linder Horizon Uses AI to Forecast the Market
A forecasting model built for price data, not a chatbot guessing at a chart
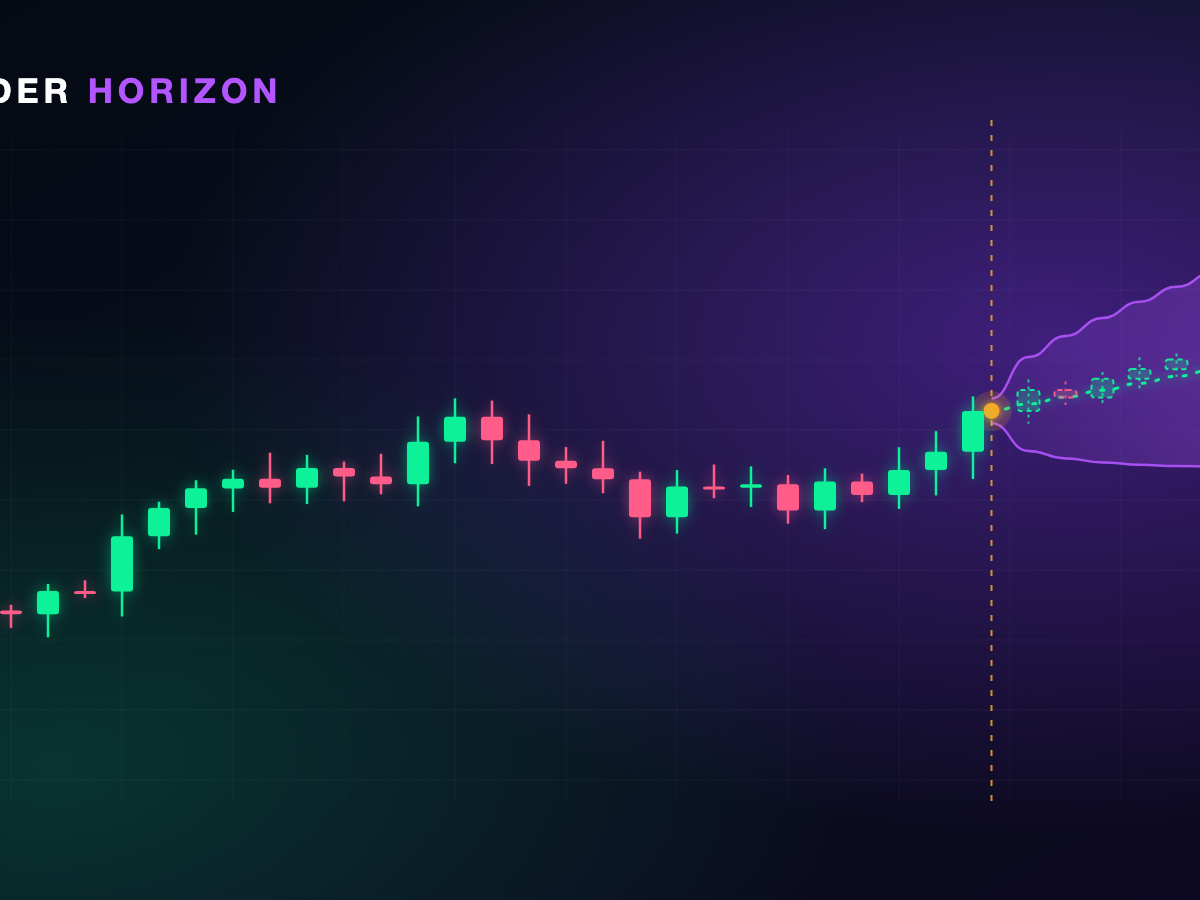
Most tools that promise "AI market analysis" work the same way: a general chat model is handed some prices and a few headlines, then asked to write an opinion. That is useful for explanation. Forecasting is a different job, and at Linder it is done by a different kind of AI. This article explains, in general terms, how Linder Horizon works and how to read what it tells you.
Two kinds of AI, two different jobs
A language model is trained on text. It is good at reading, summarising and explaining. It was not built to work with numbers that unfold over time, and that is exactly what a price chart is.
Linder Horizon is a forecasting model: a neural network built for time-series data, meaning values ordered in time, and fine-tuned on crypto markets. It does not read headlines and it does not write sentences. It studies how the price has moved and estimates how the next stretch is likely to unfold. The same family of technology is used to forecast things like energy demand and sales.
What Horizon forecasts
You pick a market (a coin, a US stock or a Saudi stock) and a timeframe, from 15 minutes up to a week. For that candle, Horizon gives you three things:
Direction: whether the candle is more likely to close bullish or bearish, with a confidence level.
Range: the highest and the lowest price it expects inside the candle.
Close: the price the candle is expected to close at.
A range, not a single number
Nobody can name the exact price an hour from now, and a model that pretends to is only hiding its uncertainty. Horizon works with probabilities. Instead of one number, it gives a band the price is expected to stay inside, built to hold about 80% of the time. A wide band means the market is uncertain, a narrow one means it is calm. The width is information in itself.
The same goes for direction. When the odds are close to even, Horizon makes no call at all. "Not sure" is an honest answer, and often a useful one: it may simply be a candle to sit out.
The forecast updates as the candle forms
The first forecast is made when the candle opens, which is when the least is known. As the candle develops, Horizon can check again and adjust to the new data. On the page this is called Pulse. A read made late in a candle knows more than one made at the start, so it is naturally easier to get right. Keep that in mind whenever you compare two reads.
Where the language AI still fits
Numbers alone do not teach much. So the two kinds of AI work together: Horizon provides the forecast, and Linder's AI analysis adds what a forecasting model cannot see, such as recent news and the wider context, then explains the whole picture in plain Arabic or English. You can ask it follow-up questions about any part you did not understand.
We publish the results
Any forecasting tool can call itself accurate. We think the only fair answer is to show the record. Every Horizon forecast made on the site is checked against the real candle once it closes, and the results are on a public track record page. The figures are split by how early in the candle the call was made, not blended into one flattering number, and they sit next to what always guessing "up" would have scored.
What Horizon cannot do
It cannot see surprises. A hacked exchange, a sudden regulatory decision or one post from an influential person can move a market in minutes. No model that learns from past prices can see those coming.
It is not right every time. By design, the close lands outside the range about one time in five, and a direction call can be wrong even at high confidence.
It is not equally strong everywhere. Horizon is fine-tuned on crypto markets. Stocks currently use the base model, and a stock-tuned model is planned.
A forecast is not a decision. Your position size, your stop and how much risk you can carry are still yours to decide.
How to use it well
Form your own view first. Read the chart, decide what you expect, then compare it with Horizon. The disagreements are where you learn the most.
Read the confidence, not only the direction. A weak call and a strong call are not the same signal.
Watch the candle against the range. Seeing where the price respects the band and where it breaks out teaches you how that market behaves.
Practise before you risk money. Horizon includes paper trading with no real money, so you can test an idea and see how it would have gone.
Horizon is free to try. Create a free account, search any coin or stock, and watch the next candle form over its forecast.
Summary
Linder Horizon is a specialised forecasting model, not a chatbot. It turns price history into a direction, a range and an expected close, updates them as the candle develops, and has its results checked in public. Use it to learn how markets move and as a second opinion, never as a promise.
This article is for educational purposes only and is not investment advice or a recommendation to buy or sell. Forecasts are estimates and can be wrong. Trading carries risk, and you can lose some or all of your capital.